The Money Is In The List – Hybrid Connect

As you have probably have heard by now when it comes to making money on the internet regardless of your industry is ” the money is in the list”


What do people mean by that?

The money is in your email list… and if you are not capturing emails on your website then you are leaving a ton of money on the table.


One of the reasons why getting an email so so important is because regardless of how well your website converts, most people are not ready to buy

right then and there. An email is always the first part of the sales funnel. In order to get people to opt-in (sign up) to your email list you need to provide

them with something truly of value. Maybe something like 7 tips on how to mow your yard (if your in landscaping) or a whitepaper that answers a problem

for your audience.


3 Different Ways To Get An Email

  1. pop-up
  2. siderbar
  3. under blog post


With Hybrid Connect I was able to easily add this opt-in form on the sidebar of the blog:

hybrid-connect

So what is my final say on Hybrid Connect?

I think it is an incredible tool that makes it easy to quickly build and customize opt-in forms and squeeze pages. I would highly recommend this product
to anyone with a website. You can buy it here (affiliate link) or through here (non affiliate link).

Keep in mind that we set-up hybrid connect on all of our clients websites for FREE. We do this because we know that at the end of the day traffic is only as good as you can monetize it.


Walking in the dark without website analytics?

Most businesses fail to recognize the importance of metrics especially when building web presence. Without metrics, how would entrepreneurs gauge and find loopholes in their online business?

Metrics help identify patterns, trends, problem areas and forecast successes. Before making major decisions, startups consult their metrics. However, with millions of websites out there, tracking growth and competition on the web can be a real challenge.

Thanks to Google Analytics, collecting and analyzing data, monitoring and managing a site is made easier. This powerful, free tool is meant to clarify and shed light to businesses or Internet marketers by providing insight from keywords, design elements to any bit of information needed to improve online presence.

Newbies get a lot of sleepless nights trying to figure Google Analytics out. If you’re one of them and feel dumbfounded or your website has been walking in the dark for some time now, it’s time to be enlightened. Here’s our guide to the basics of Google Analytics:


Google Analytics Home

Once you have your Google Analytics account set up, the next step is to embed the code on your website.

Establish a profile for the website that you’d like to monitor and manage and the step-by-step process will automatically generate a script that you can copy/paste. If you’re using blogging platforms like Blogger, Tumblr, or WordPress or a content management system you only need to install the code once to your theme or template.

1


If your website is custom-built, you’ll need to manually embed the code on each page or get help from your web developer to assist you with it.

Copy and paste the code from Analytics to just above the <head/> tag in your page or template. Embedding this code will not affect your site’s visual appearance.


What Metrics can do for you

 After successfully connecting your website to Google Analytics, click “View Report” on the initial screen. This will redirect you to the main dashboard. In the left column, you’ll find different types of data Google Analytics provides:

  • Visitors – This tells you how many people come to view your website including location, language, how often they visit, and the browser or computer they log in from to get to your site.
  • Traffic Sources –From here, you are able to trace which keywords direct people to your site and which sites link to your webpage.
  • Content – This tab provides information into specific pages on your site. It can tell you what type of posts are most popular and help give answers as to how people enter and exit your site.
  • Goals – In this tab, you’ll find relevant information and significant data on desired actions from users, registrations, purchases and download hits.
  • Ecommerce – This tab is only useful if you’re selling products online as it displays all inventory and merchandise information.

These tabs mainly provide insights about certain divisions of your website, including top content, audience engagement and loyalty.

Whatever data you choose to monitor depends on the concerns you have for your site. For example, if your site is heavy on text like a news site, regularly update with keyword searches to help boost your online presence.

The key to easing in with Google Analytics is figuring out where you would like to focus on most.


Setting up the dashboard

The Google Analytics dashboard will provide you a visual outlook of a summary report to your site’s data. If you wish to customize the dashboard with whichever reports you want seen upfront, just go to the left column, click on the type of report to display and click “add to dashboard”. You may also position reports on the dashboard by dragging and dropping or even deleting whichever you choose.

Google-Analytics-Dashboard


You can dig in deeper into information established by hitting “View Report” located underneath the report graphic on your dashboard. A full report on your chosen topic will pop up.


Adjusting the Calendar

Before analyzing information from your reports, don’t forget to tweak the date range found in the upper right hand corner. Note that it defaults to a month long range, ending the day before the day you’re viewing the report. For instance, on March 3, the timeline for the report would be from Feb 3 to March 2.) Hit on the date range box and a calendar will appear. You have the option to adjust it to track or monitor data on a daily, weekly, quarterly, or whatever time frame that works best for you.

google_analytics_calendar

If you’d like to compare reports from 2 weeks ago to last week or whatever time frame, just click “Comparison” underneath the date range tab. A second calendar will pop up for you to adjust the time periods you want to consider.


Data Reports and Graphs

You will discover that most of the reports in Google Analytics such as page views and conversion rates are presented in linear graphs with the topic and date range chosen. Hovering your mouse over the dots will allow you to see measurements for that day, week or hour.

googlereporting-1


If you want to change the metric you wish to see, you may do so by simply clicking the tab above the graph on the left. You will then be presented with the option to compare two reports against each other. You can also compare against the site average. This is especially helpful if you’ve established objectives, as you can compare conversion goals to site activities.

Just below the graph, you’ll see more information displayed with summaries and scorecards showcasing overall metrics including pages per visit and time on site. A detailed metric report can be found in a table below. You can choose to see the report in a pie chart or bar graph by hitting on the icons just above the and to the right of the scorecards. You also have the option to make the data more accurate through the “Find Source” box and just type in the keyword relevant to your search.

If you’re skeptical about a certain measurement term, hit the question mark icon next to it and an explanation box will appear.


Sharing Reports

You’ll find an email icon at the top of the reports. You may send the report immediately, set or preschedule reports to send or if you’re presenting the report, export it as PDF (Google Analytics recommends this best), XML CSV or TSV file.

benchmarking


With the help of our Google Analytics guide, by this time you are able to find out for yourself if this tool is something you would prefer to live with or live without. The question is – how do you intend to make your online presence grow and survive? Tell us your thoughts!


How to Use Instagram to Promote Your Business

Once a trend, Instagram (launched in 2010 by genius co-founders Mike Krieger and Kevin Systrom) has evolved to one of the best developed promotional tools that have become adamant to every online business’ marketing tactic. It is now widely used for advancing into the social sphere of the large internet marketing industry – where everyone gambles their way into success.instagram

How is Instagram helpful to your business? With more than 150m users and a continuously multiplying number on a global scale, this image and web video social free-sharing platform can significantly increase your brand or business’ online presence.

Unlike Facebook or Twitter (two of the most on demand social platforms to date), Instagram does not cater to one-niche services, product or business, does not have built-in visibility or metrics, or paid ad options. People enjoy using Instagram because it’s:

Simple and user-friendly – Instagram enables users to customize photos creating artistic masterpieces with a personal touch. From the app, you can link and share posts to other social platforms like Facebook, Twitter, Flickr and email – automatically.

Visual story-telling with no ad pop ups – Both technology and experience allow people to establish online presence through visual storytelling that gives room to creativity and continuity than most platforms.

Suits people’s needs to a T – Combining the best of both worlds (mobile and photo sharing) to come up with a unique platform that offers real value to web based businesses. Personal or company brands can take advantage of these two, in one action.

Get started with Instagram by simply signing up for a free account (if you have a Twitter account, we suggest using the same name as your Twitter handle), add a profile photo (brand logo) and a link to your website and don’t forget your account to Facebook – let your network know they can follow you there!

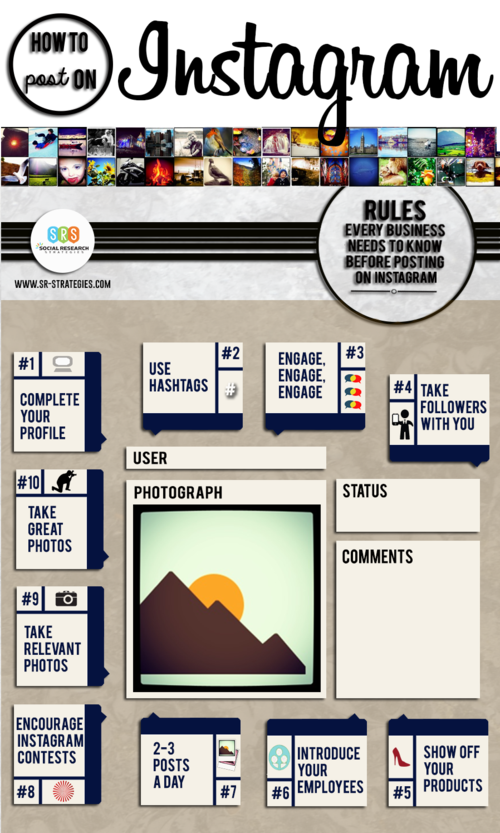
It’s an easy set-up but utilizing Instagram can be confusing to some. So whether you’re new to this or have some knowledge about it, you can still learn a few tips and tricks to getting the most out of Instagram:

Instagram_filter620

Create posts that

Display your products – It could be the whole product line or a specific selection. Hashtagging your images is an important part of the sharing process. By using #keyword people will be able to find or identify whatever they are looking for – be it a product, service, answer or brand.

Map out the process – Share the world step by step photos of the manufacturing process or how. People appreciate transparency.

Let people take a peep into “behind-the-scenes” scene – People are naturally curious so bring able to give them a glimpse into actions that take place behind the business is always a good way to make your audience have a feel of say, an event, a class, a photo shoot session.

Show before-and-after results – This strategy helps people who are involved in fashion, beauty and interior design or building industries. Make a collage of before and after images to showcase your skills.

Showcase your workstation – Build a personal connection by showing your audience where the magic happens.

Share your world – If you’re attending a conference, event or workshop let people have a feel of that experience through image story-telling.

Introduce your people – Reveal the fun and creative vibe of your workforce and how they put into good use your product or service.

Throw an Instagram contest and give out rewards– Offer freebies, discounts or incentives and ask your followers to part take, tag a friend and even possibly share the reward. It always keeps the ball rolling!


Captivate and engage the audience

Instagram-IG.png

Use relevant and appropriate hashtags –Hashtags are the key element to going viral. How to use a hashtag effectively? #keyword – could be a word or phrase anything you think that would help people find your product, service, business and even your personal brand. Limit using 5 hashtags to a photo post.

Involve your customers – Tell your customers or loyal fan base to take photos of them showing off a product they purchased from you or the result of your services using a specific hashtag so that when people type it in, they automatically find a collection of photos. If you’re on the ecommerce business, provide a link to the product page.

Reach out – Respond to comment, requests and questions by following, commenting or liking back.

Cross-channel publish content– Publish a post on several social media platforms and link your Instagram account.

Ask for feedback – Businesses or companies succeed because their customers help them so. One of the best ways is to ask your customers feedback: What do you like best about our products or services? How can we be of better service to you? People outside your business see the good and bad points. This will help you reassess and make right the wrong.

Throw promotions – Give your customer the opportunity to gain a free product, opportunity or experience and don’t forget to hashtag. You’ll be surprised how your follower base multiply exponentially by this tactic.
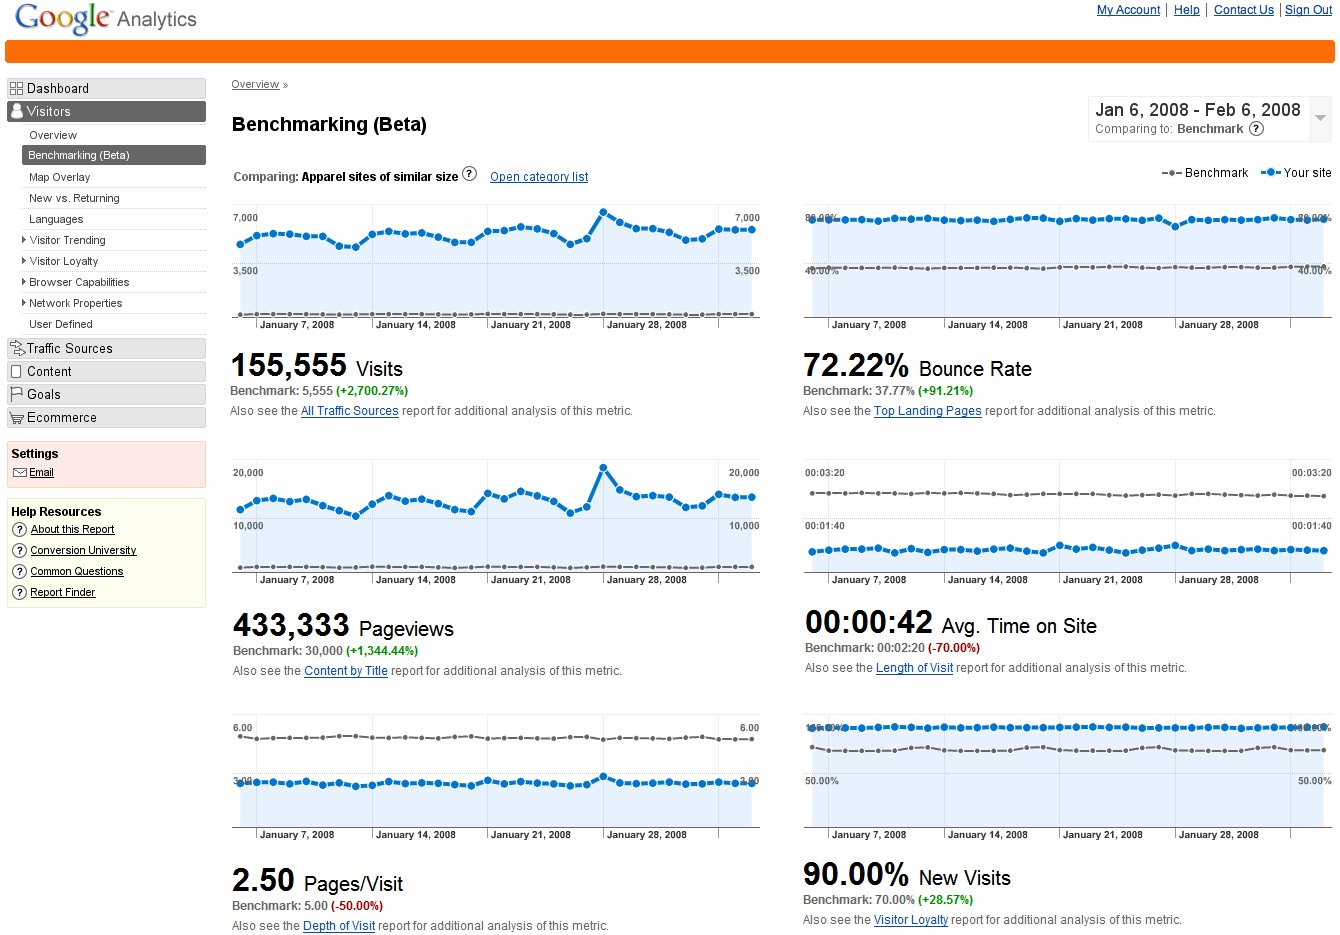
 

Measure Success

No online business succeeds without metrics. Metrics is relevant to helping you determine where your business is and where it’s going.
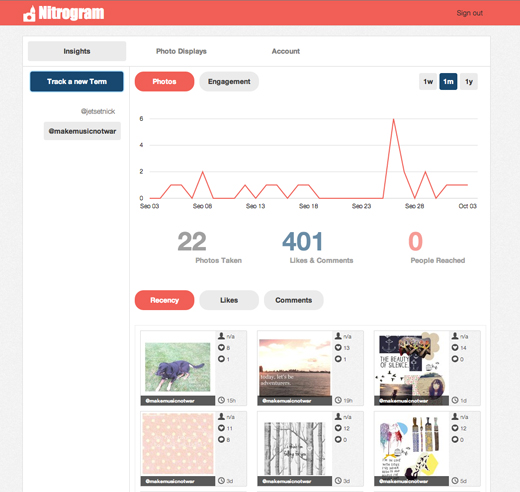
nitrogram1

Track and measure hashtags – Get valuable information on your campaign.

Account reporting – Learn more about your followers and how the tricks of the trade impact the success of both your network and business.

Measure competition – Find out how your campaign positioned you in other companies. Find out how you can stay ahead of the game.


In conclusion, as the old saying goes: “A picture is worth a thousand words” As it still very much stands true, with Instagram, one picture could mean a thousand likes and shares! In addition to that, Instagram 15-second short, video clips make the sharing experience all the more fun and exciting!
Are you using Instagram yet? Tell us how you’re using Instagram to promote your business!