Tag Archives: How to Google Analytics

Improve your Marketing with Google Analytics

Google Analytics is a free web analytics service designed by Google. This service provides statistical and basic analytical tools. It also lets the user know how many times a person is using their website. Google analytics also lets you monitor your own website traffic. It also allows you to track your user’s location and how and why they are visiting your site.

Here are nine Google analytic tips for you to improve your marketing:


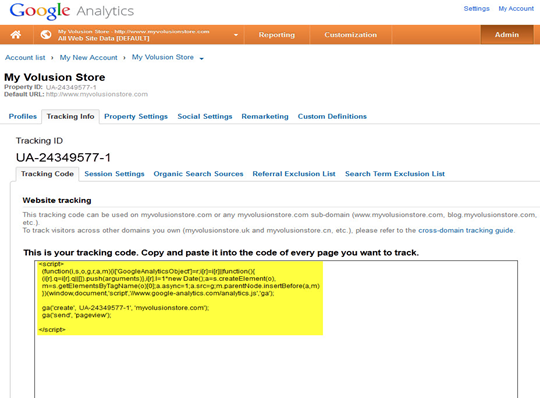
Tip 1: Combining WordPress and Google Analytics


analyticswp

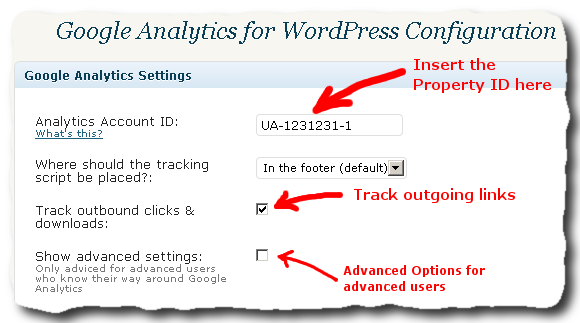
Through Yoast plugin by Google Analytics, you could add the Google analytics in your WordPress account.

The Yoast plugin has advance features like internal links that could redirect you to external sites and tracking outbound clicks, even downloads.
Bothered by the traffic from admins and other users? You could use the plugin to ignore the traffic. Also, you could track results page and even 404 pages.

If the Yoast plugin itself has advance features, what more do you expect in the premium version? The Yoast’s premium version can let you track views per post type, views per author and many more other dimensions.


Tip 2: Integrating analytical platforms


ga

Segment is the best service for you if you are planning to combine your Google Analytics with platforms that could let you know about your website’s traffic and some analytical tools. Segment can let you manage data for more than a hundred different advertising, developer, sales, analytics and testing platforms for users. The user testing platforms are in one area.

Installing is the easiest part. Segment does all the work. You just have to install a tracking code but only one tracking code. After installing one tracking code to your website, Segment will manage the rest of your tracking code.

If you are wondering, Segment does offer a free package if you are using the Google Analytics, it also offers twenty specific other platforms when you are using Google Analytics. The monthly rate starts at $29 a month, but it will depend on the integration you need.


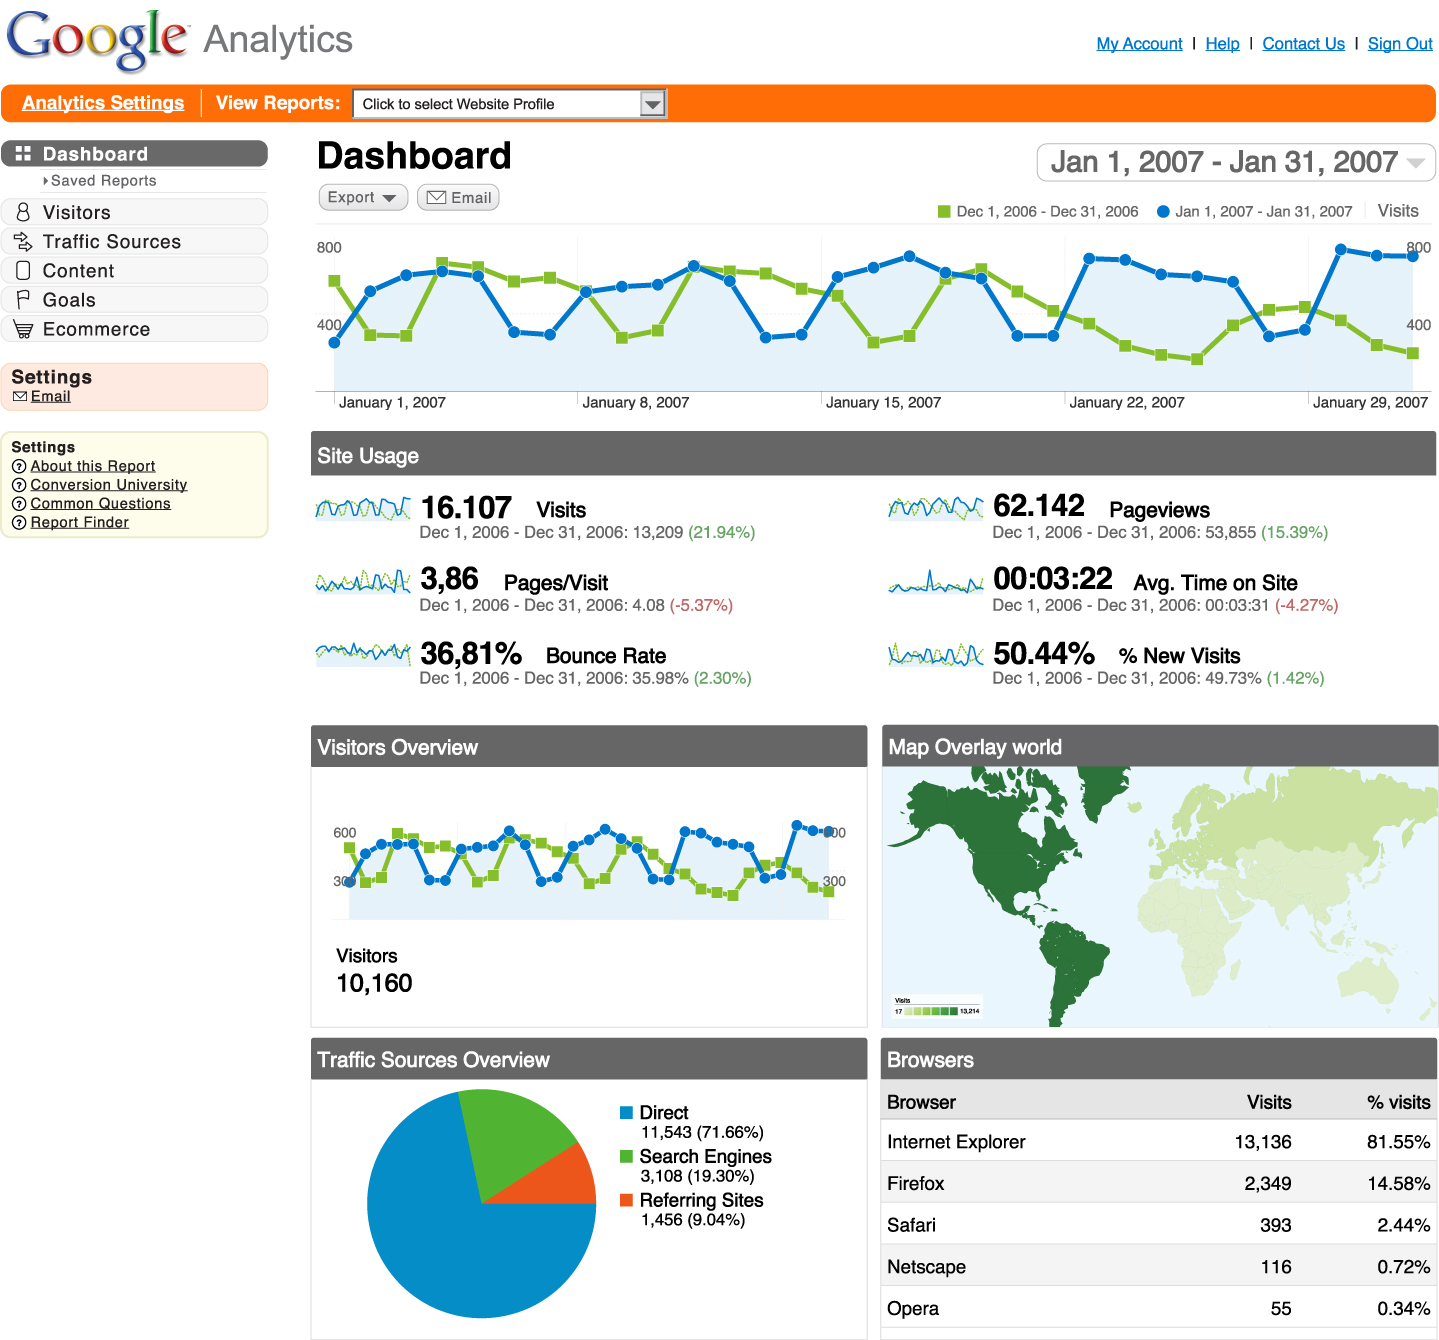
Tip 3: Google data analytics in a visual way


Google-Analytics

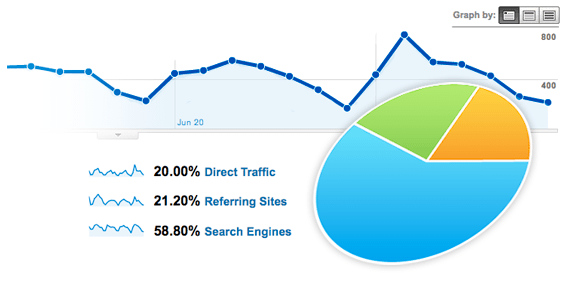
Ever wonder if there is a possibility to do two things at the same time like, to view and compare multiple website? Well, there is, it is possible. The tool is called Cyfe. It allows you to compare and view data from websites that you have chosen in Google Analytics at the same time. It makes life easy (well not life itself).

Use the Cyfe dashboard to see the overall view of all your websites’ page views, sessions and even users. First, analyze all the data; next identify the bigger trend of conversions, location of user and the bounce rate. Also, the search engine traffic and the social networks.

The best part is, you can create a dashboard with your websites’ real traffic time and it’s a detailed view. It includes the location of the use, their viewing content and the traffic sources.

The benefit of the premium upgrade allows you to create dashboards for an unlimited time (I think this will really come in handy if you really want to improve your marketing), blogging, sales, and many more. The premium upgrade is $19 a month. Not bad for an upgrade, the price you pay is okay because the package is so much useful.


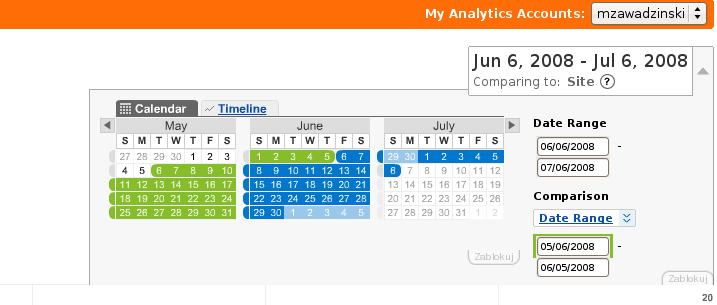
Tip 4: Knowledge about traffic in email marketing


email-marketing-logo-small

There are is a wide variety of marketing platforms, there is MailChimp, Constant Contract, Vertical Response and GetResponse. These marketing platforms have the ability to trace traffic from the links in the specified emails you have to the email campaigns you have.

Let’s say that you chose the marketing platform, MailChimp. This platform allows you to check only a single box to add the UTM parameters. You can also view the traffic inside the Google Analytics, there will be links inside the analytic. If you want to track your campaign archive page and automation emails, set up the Google Analytics tracking. It could also be helpful.


Tip 5: Social


5555

Do you these social media management tools: Buffer,Oktopost and Hootsuite? Well, if you do, did you know that you could benefit for linking all those social media management tools to Google Analytics.

Here are the benefits you get from linking them to Google Analytics:

If you will be linking Hootsuite, you will have a report of an overview using Google Analytics data, and social updates that you have published in the website.

When you link Buffer, it allows you to customize UTM parameters. Using the UTM parameters, you could track the custom campaigns within the Google Analytics, it matches the updatest that you have posted in Buffer. But then this is an option, this is only available in the business plans of Buffer, the monthly rate is $50.

Next stop is Oktopost. When linking Oktopost, it allows you to enable Google Analytics to automatically add UTM parameters. But still, this option is in the Oktopost premium plan. The monthly rate is $49.


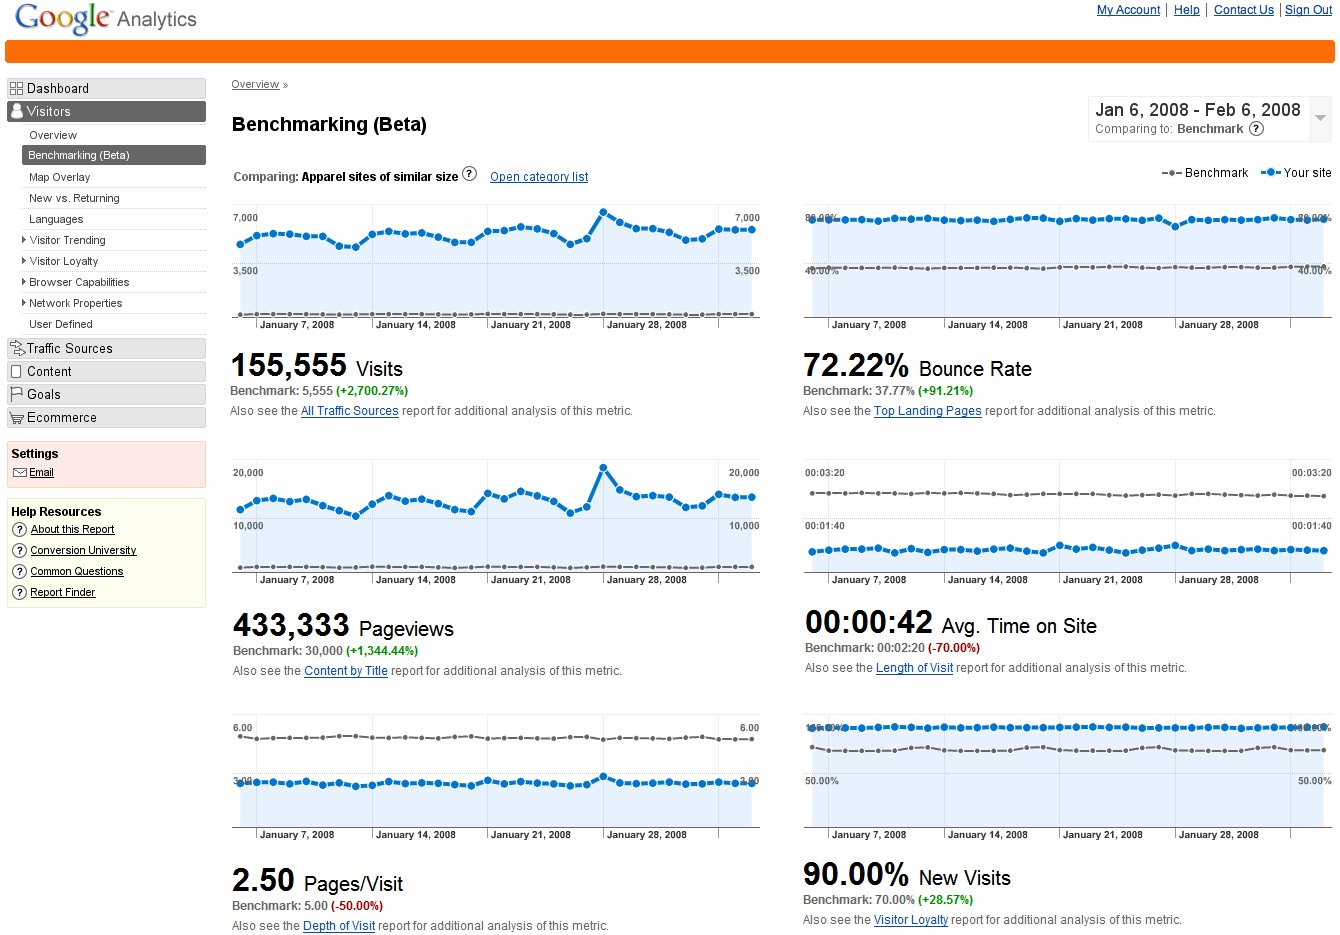
Tip 6: Know whether the Google update has an effect to your website


gaweb

How would you know if Google updates affect your website? The first step is to add Fruition Google Penalty Checker. The checker could analyze the data from your account in Google Analytics. It could also determine whether your site has a positive or negative effect by the Google updates.


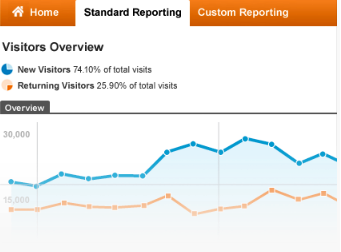
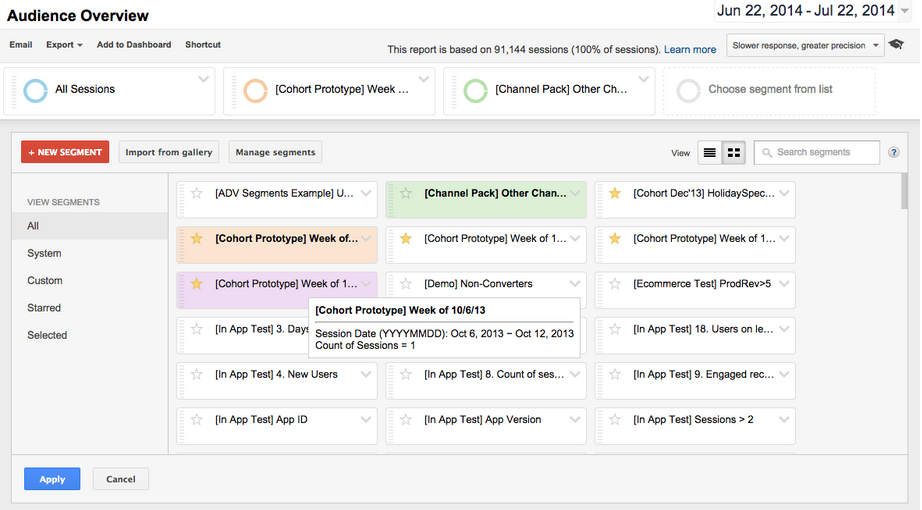
TIp 7: Better know your keywords (not the provided ones)


authority_labs_rank_monitoring

A search engine marketer’s worst nightmare is when they loss keyword data in Google Analytics. But there are several tools that try to recapture the data, AuthorityLabs is an example of this tool.

The AuthorityLabs does not only let you monitor the search engine ranks. It also determines the keywords that are luring your visitors to view your website.


TIp 8: Insight from splitting test


splittest

Put together Optimizely or Visual Website Optimizer with you Google Analytics, it also can receive the traffic you track down.


Tip 9: Linking e-commerce sales data with Google analytics


ecom

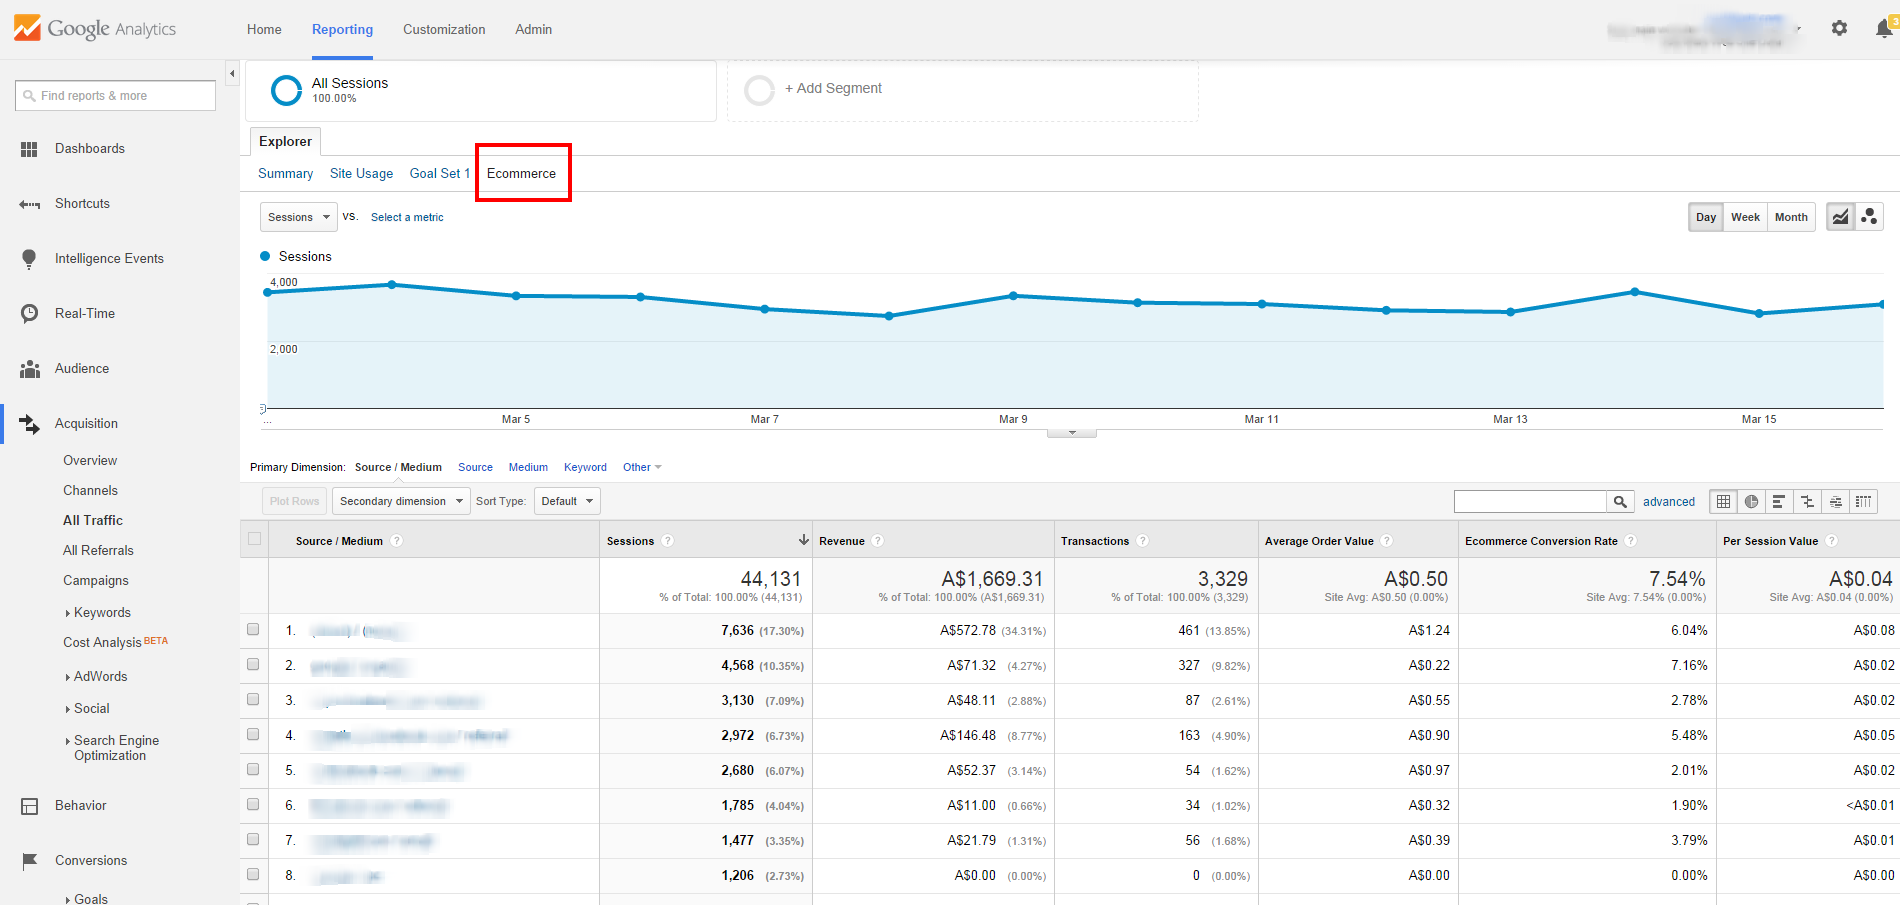
Shopify, Magneto and Bigcommerce are e-commerce platforms. These platforms offer instruction on how you can integrate with Google Analytics.

You could learn plenty of things about your ecommerce revenue from these reports. From products that generates the most to the top traffic sources who purchases your product.

Walking in the dark without website analytics?

Most businesses fail to recognize the importance of metrics especially when building web presence. Without metrics, how would entrepreneurs gauge and find loopholes in their online business?

Metrics help identify patterns, trends, problem areas and forecast successes. Before making major decisions, startups consult their metrics. However, with millions of websites out there, tracking growth and competition on the web can be a real challenge.

Thanks to Google Analytics, collecting and analyzing data, monitoring and managing a site is made easier. This powerful, free tool is meant to clarify and shed light to businesses or Internet marketers by providing insight from keywords, design elements to any bit of information needed to improve online presence.

Newbies get a lot of sleepless nights trying to figure Google Analytics out. If you’re one of them and feel dumbfounded or your website has been walking in the dark for some time now, it’s time to be enlightened. Here’s our guide to the basics of Google Analytics:


Google Analytics Home

Once you have your Google Analytics account set up, the next step is to embed the code on your website.

Establish a profile for the website that you’d like to monitor and manage and the step-by-step process will automatically generate a script that you can copy/paste. If you’re using blogging platforms like Blogger, Tumblr, or WordPress or a content management system you only need to install the code once to your theme or template.

1


If your website is custom-built, you’ll need to manually embed the code on each page or get help from your web developer to assist you with it.

Copy and paste the code from Analytics to just above the <head/> tag in your page or template. Embedding this code will not affect your site’s visual appearance.


What Metrics can do for you

 After successfully connecting your website to Google Analytics, click “View Report” on the initial screen. This will redirect you to the main dashboard. In the left column, you’ll find different types of data Google Analytics provides:

  • Visitors – This tells you how many people come to view your website including location, language, how often they visit, and the browser or computer they log in from to get to your site.
  • Traffic Sources –From here, you are able to trace which keywords direct people to your site and which sites link to your webpage.
  • Content – This tab provides information into specific pages on your site. It can tell you what type of posts are most popular and help give answers as to how people enter and exit your site.
  • Goals – In this tab, you’ll find relevant information and significant data on desired actions from users, registrations, purchases and download hits.
  • Ecommerce – This tab is only useful if you’re selling products online as it displays all inventory and merchandise information.

These tabs mainly provide insights about certain divisions of your website, including top content, audience engagement and loyalty.

Whatever data you choose to monitor depends on the concerns you have for your site. For example, if your site is heavy on text like a news site, regularly update with keyword searches to help boost your online presence.

The key to easing in with Google Analytics is figuring out where you would like to focus on most.


Setting up the dashboard

The Google Analytics dashboard will provide you a visual outlook of a summary report to your site’s data. If you wish to customize the dashboard with whichever reports you want seen upfront, just go to the left column, click on the type of report to display and click “add to dashboard”. You may also position reports on the dashboard by dragging and dropping or even deleting whichever you choose.

Google-Analytics-Dashboard


You can dig in deeper into information established by hitting “View Report” located underneath the report graphic on your dashboard. A full report on your chosen topic will pop up.


Adjusting the Calendar

Before analyzing information from your reports, don’t forget to tweak the date range found in the upper right hand corner. Note that it defaults to a month long range, ending the day before the day you’re viewing the report. For instance, on March 3, the timeline for the report would be from Feb 3 to March 2.) Hit on the date range box and a calendar will appear. You have the option to adjust it to track or monitor data on a daily, weekly, quarterly, or whatever time frame that works best for you.

google_analytics_calendar

If you’d like to compare reports from 2 weeks ago to last week or whatever time frame, just click “Comparison” underneath the date range tab. A second calendar will pop up for you to adjust the time periods you want to consider.


Data Reports and Graphs

You will discover that most of the reports in Google Analytics such as page views and conversion rates are presented in linear graphs with the topic and date range chosen. Hovering your mouse over the dots will allow you to see measurements for that day, week or hour.

googlereporting-1


If you want to change the metric you wish to see, you may do so by simply clicking the tab above the graph on the left. You will then be presented with the option to compare two reports against each other. You can also compare against the site average. This is especially helpful if you’ve established objectives, as you can compare conversion goals to site activities.

Just below the graph, you’ll see more information displayed with summaries and scorecards showcasing overall metrics including pages per visit and time on site. A detailed metric report can be found in a table below. You can choose to see the report in a pie chart or bar graph by hitting on the icons just above the and to the right of the scorecards. You also have the option to make the data more accurate through the “Find Source” box and just type in the keyword relevant to your search.

If you’re skeptical about a certain measurement term, hit the question mark icon next to it and an explanation box will appear.


Sharing Reports

You’ll find an email icon at the top of the reports. You may send the report immediately, set or preschedule reports to send or if you’re presenting the report, export it as PDF (Google Analytics recommends this best), XML CSV or TSV file.

benchmarking


With the help of our Google Analytics guide, by this time you are able to find out for yourself if this tool is something you would prefer to live with or live without. The question is – how do you intend to make your online presence grow and survive? Tell us your thoughts!